The Score Is an Indicator, Not a Verdict
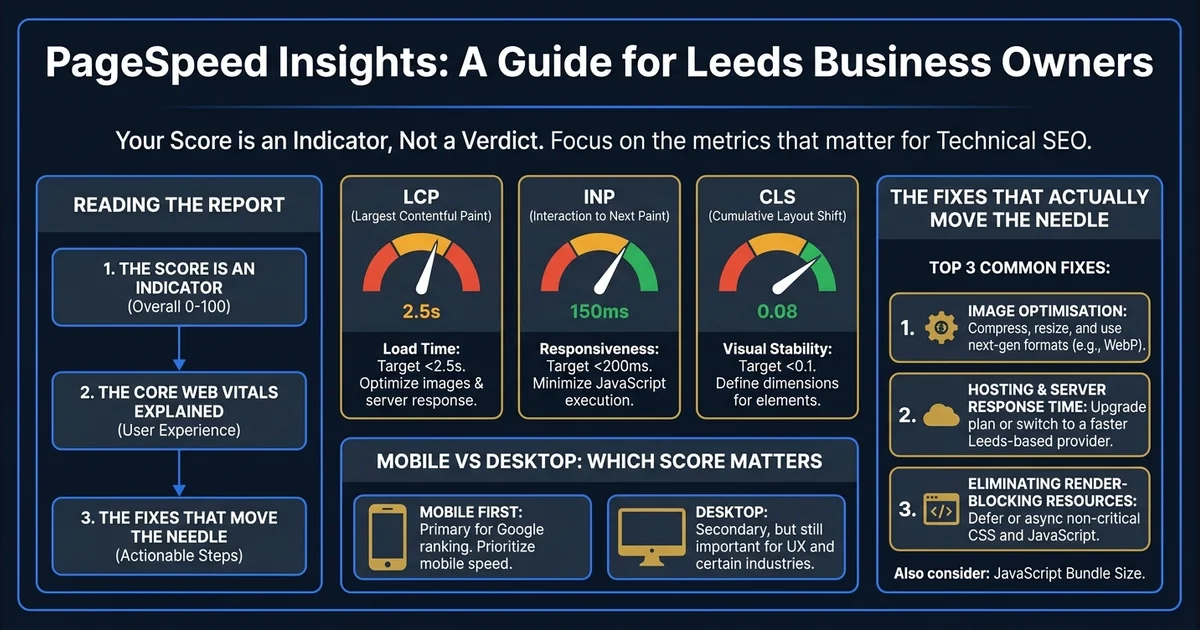
The PageSpeed Insights score — that number out of 100 — is the thing most people focus on. It is a useful indicator of overall performance health, but it is not what directly determines your search ranking.
A site can score 62 in the lab simulation and have acceptable field data if its real users are on fast connections and have the site cached. A site can score 88 in the lab and have poor field data if it has slow third-party scripts that behave differently in real-world conditions.
This guide explains how to interpret what you are seeing and, more importantly, what to do about it.
Reading the Report: What to Look at First
When you run your URL through PageSpeed Insights (pagespeed.web.dev), you will see two sections:
Field Data (at the top) — Real user measurements collected from Chrome users visiting your site over the previous 28 days. These are the numbers that feed into Google's ranking decisions. Each of the three Core Web Vitals — LCP, INP, and CLS — is shown as Good, Needs Improvement, or Poor.
Lab Data — A simulated test run on a standardised device and connection. Useful for diagnosing specific performance bottlenecks, but not the ranking signal.
If your Field Data shows any metric as "Poor" or "Needs Improvement," your site is being suppressed in search rankings relative to competitors who pass those metrics. That suppression is ongoing — it affects every search, every day, until the underlying issues are fixed.
The Core Web Vitals Explained
** How long until the main content of the page is visible. Usually a hero image or large heading. 5 seconds. 5–4 seconds.
** How quickly the page responds to any user interaction — clicks, taps, typing. Good: under 200 milliseconds. Needs improvement: 200–500ms.
CLS — Cumulative Layout Shift. How much the page content jumps around during loading. Good: under 0.1. Needs improvement: 0.1–0.25. Poor: over 0.25.
The Fixes That Actually Move the Needle
These are the interventions that reliably improve both PageSpeed scores and real-world Core Web Vitals, roughly in order of typical impact.
Image Optimisation
The single highest-impact fix for the majority of local business websites. Common issues:
- Wrong format. JPEG and PNG images should be converted to WebP, which achieves significantly smaller file sizes at equivalent quality. A 2MB JPEG hero image can often become a 180KB WebP with no visible quality loss.
- Wrong size. An image displayed at 800px wide should not be a 3,000px wide file that the browser downloads and scales down. Export images at their display dimensions.
- Missing lazy loading. Images below the fold should include
loading="lazy"so they are only downloaded as the user scrolls towards them, not all at once on initial page load. - Missing dimensions. Images without explicit
widthandheightattributes cause layout shift (poor CLS) as the browser does not know how much space to reserve for them before they load.
For a typical local business website, image optimisation alone can reduce LCP by one to three seconds.
Hosting and Server Response Time
Cheap shared hosting — £3–£7/month on a server housing hundreds of other websites — introduces server response times (Time to First Byte, or TTFB) of 800ms or more. Google considers TTFB above 600ms to be a concern. Poor hosting is one of the most common technical issues identified in a professional technical SEO audit.
Quality UK-based managed hosting, or hosting optimised for your platform of choice, typically delivers TTFB below 200ms. Combined with server-side caching, this has an immediate and meaningful impact on LCP scores.
Every pay-monthly website from Leodis Digital is hosted on quality, UK-based infrastructure with server-side caching configured as standard. This is a non-negotiable baseline.
Eliminating Render-Blocking Resources
Any script or stylesheet in the document <head> that loads synchronously blocks the browser from rendering content until it has finished downloading and executing. Every additional render-blocking resource delays the point at which the user sees anything on the screen.
Fixes: add async or defer attributes to non-critical scripts. Load non-critical stylesheets with a pattern that prevents them from blocking render. Audit your third-party scripts — Google Analytics, live chat widgets, cookie consent tools, marketing pixels — and ask whether each one is essential enough to justify the performance cost it imposes.
JavaScript Bundle Size
Modern JavaScript frameworks and page builders like WordPress's Elementor produce large bundles of JavaScript that take significant time to download, parse, and execute on mobile processors. This affects both LCP (time to first meaningful content) and INP (page responsiveness).
Fixes: code splitting, tree shaking, and deferring non-critical JavaScript. In practice, the most effective fix is often rebuilding on a framework that produces less JavaScript by design. This is one of the reasons Leodis Digital builds on a modern, lightweight framework rather than WordPress with page builders — the structural performance advantage from the start is significant.
Browser Caching and CDN
Set appropriate cache headers on static assets — images, fonts, stylesheets — so that returning visitors and CDN edge servers do not re-download unchanged resources. Static assets should typically be cached for at least one year with versioning to bust the cache when they change.
A Content Delivery Network (CDN) serves your assets from servers geographically close to your users. A visitor in the UK receiving files from a Leeds-adjacent server will always be faster than one waiting for files from a server in a US data centre. Most quality hosting providers include CDN functionality; ensure it is enabled and configured correctly.
Web Font Optimisation
Google Fonts loaded via a standard stylesheet link can be a render-blocking resource. Use font-display: swap to display text in a fallback font immediately while the custom font loads, preventing the browser from hiding text during the font download. Preconnect to the font origin (<link rel="preconnect">) to reduce connection latency.
Mobile vs Desktop: Which Score Matters
PageSpeed Insights reports separately for mobile and desktop. Desktop scores are almost always significantly higher — the simulated desktop environment has a fast processor and a stable connection.
For local SEO, mobile performance is what matters. Google uses mobile-first indexing — it evaluates the mobile version of your site for ranking purposes. Local search is predominantly conducted on mobile devices. Your mobile score and your mobile Core Web Vitals field data are the numbers to prioritise. The strategic case for mobile-first SEO for Leeds local businesses explains why this prioritisation matters across every aspect of your site, not just page speed.
If you are constrained and need to choose where to focus improvement effort, focus on mobile.
What to Do After Making Improvements
After implementing performance fixes, monitor your Core Web Vitals field data in Google Search Console over four to six weeks. Field data reflects real user experience and updates as new Chrome sessions are recorded — you will not see the full impact on the day changes are deployed. Build this monitoring into your monthly SEO measurement process alongside your traffic and enquiry tracking.
For larger improvements, expect to see the field data change meaningfully within 30 days. Keep a log of what changed and when so you can attribute improvements to specific fixes.
When to Consider a Fresh Start
There is a ceiling to how much a WordPress site built on a heavy theme or page builder can be improved without a fundamental rebuild. Image optimisation, caching, and script deferral can make meaningful improvements, but if the underlying framework generates 400KB of render-blocking CSS that cannot be reasonably eliminated without rebuilding the templates, you are working around a structural problem.
A professionally built website on a modern, lightweight framework starts above the ceiling that a typical WordPress build can reach with optimisation. If you have invested time in fixing performance issues on your current site and are still scoring below 70 on mobile, a fresh build may deliver better returns than continued incremental improvement.
This is one of the clearest arguments for a pay-monthly website: for a fixed monthly fee, you get a site built to the right technical standard from the outset. There is no accumulating technical debt, no ceiling from poor initial architecture, and no ongoing performance problem that gradually erodes your search visibility.
For a deeper explanation of how these metrics affect your local search rankings, read our Core Web Vitals guide for UK businesses. If you want to understand the revenue impact of poor performance, see our article on how website speed affects conversions and revenue.
Ready to know where your site stands? Contact Leodis Digital for a free performance assessment — we will run your site through the right tools and give you a clear picture of what it is costing you in search visibility.
Frequently Asked Questions
What is a good PageSpeed Insights score for a local business website?
Aim for 90+ on both mobile and desktop. A score of 90 or above puts you in the "Good" range and typically means you are passing Core Web Vitals, which are the ranking signals that actually matter. Scores in the 70–89 range are acceptable but leave room for improvement. Below 70 — particularly on mobile — suggests structural performance issues that will be suppressing your search rankings. Many WordPress sites built on page builders score 35–55 on mobile, which is a significant competitive disadvantage.
Why does my site score differently on mobile and desktop?
PageSpeed Insights simulates a mid-range mobile phone on a 4G connection for the mobile test, and a desktop computer on a fast connection for the desktop test. Mobile scores are almost always lower because mobile devices have slower processors and less memory, and mobile connections are less consistent than fixed broadband. Google uses mobile performance for ranking because most local searches happen on mobile phones. The mobile score is the one that matters most for local SEO.
Can I improve my PageSpeed score without rebuilding my website?
Yes, in many cases. Image optimisation alone can dramatically improve scores on image-heavy sites. Switching to quality UK-based hosting, adding server-side caching, and deferring non-critical scripts can each contribute meaningfully. However, if your site is built on a heavy page builder or WordPress theme with fundamental structural performance issues, there is a ceiling to how much can be improved without a rebuild. A properly built website on a modern framework starts above that ceiling.
Should I use a free PageSpeed tool or pay for a professional audit?
Google's PageSpeed Insights is free and is the authoritative source for the metrics that affect your rankings. It is the right starting point for any business owner. However, it tells you what the problems are, not how to fix them or which fixes will have the greatest impact. A professional technical audit adds that layer of prioritisation and specific remediation advice. For businesses where the website is a primary lead generation channel, the investment in a proper audit typically pays for itself many times over.
Found this useful? Share it.